7.5 — Program Metrics & Continuous Improvement
Listen instead
Learning Objectives
- ✓ Design a metrics program that measures the effectiveness of the SSDLC program using leading and lagging indicators.
- ✓ Conduct an OWASP SAMM self-assessment to establish baseline maturity and define target states.
- ✓ Use BSIMM benchmarking to compare your program against industry peers.
- ✓ Define and track AI-specific metrics for AI-augmented development.
- ✓ Build executive and technical dashboards that communicate program value and guide resource allocation.
- ✓ Implement a continuous improvement cycle that uses data to drive program evolution.
1. Why Metrics Matter
“You can’t improve what you don’t measure” is a cliche because it is true. An SSDLC program without metrics is operating on faith — faith that training is effective, faith that tools are catching vulnerabilities, faith that the investment is paying off. Faith is not a strategy.
Metrics serve four critical functions:
Demonstrate ROI: Security programs compete for budget with every other business priority. Metrics that show measurable improvement in vulnerability density, detection rates, and remediation times make the case for continued — or increased — investment.
Identify trends: A single data point tells you where you are. A trend tells you where you are going. Rising vulnerability density may indicate scaling problems, technology migration challenges, or training gaps. Declining MTTR may confirm that process improvements are working.
Inform resource allocation: Limited resources must be applied where they have the greatest impact. Metrics reveal which teams, technologies, or vulnerability types need the most attention. Without data, resource allocation is guesswork.
Create accountability: Metrics make commitments measurable. “We will improve our security posture” is a wish. “We will reduce our critical vulnerability MTTR from 14 days to 7 days by Q3” is a goal. Goals can be tracked, reported on, and held accountable.
CIS Control 16.1 — Secure Application Development Process
CIS 16.1 requires establishing and maintaining a secure application development process. Metrics are how you demonstrate that the process is functioning and improving.
CIS Control 16.9 — Training Program for Application Developers
CIS 16.9 requires that developers receive application security training appropriate to their role. Metrics demonstrate that training is being delivered, completed, and having an impact on security outcomes.
2. OWASP SAMM Self-Assessment
The OWASP Software Assurance Maturity Model (SAMM) is the most widely used framework for assessing and improving software security programs. It provides a structured way to evaluate where you are, define where you want to be, and build a roadmap to get there.
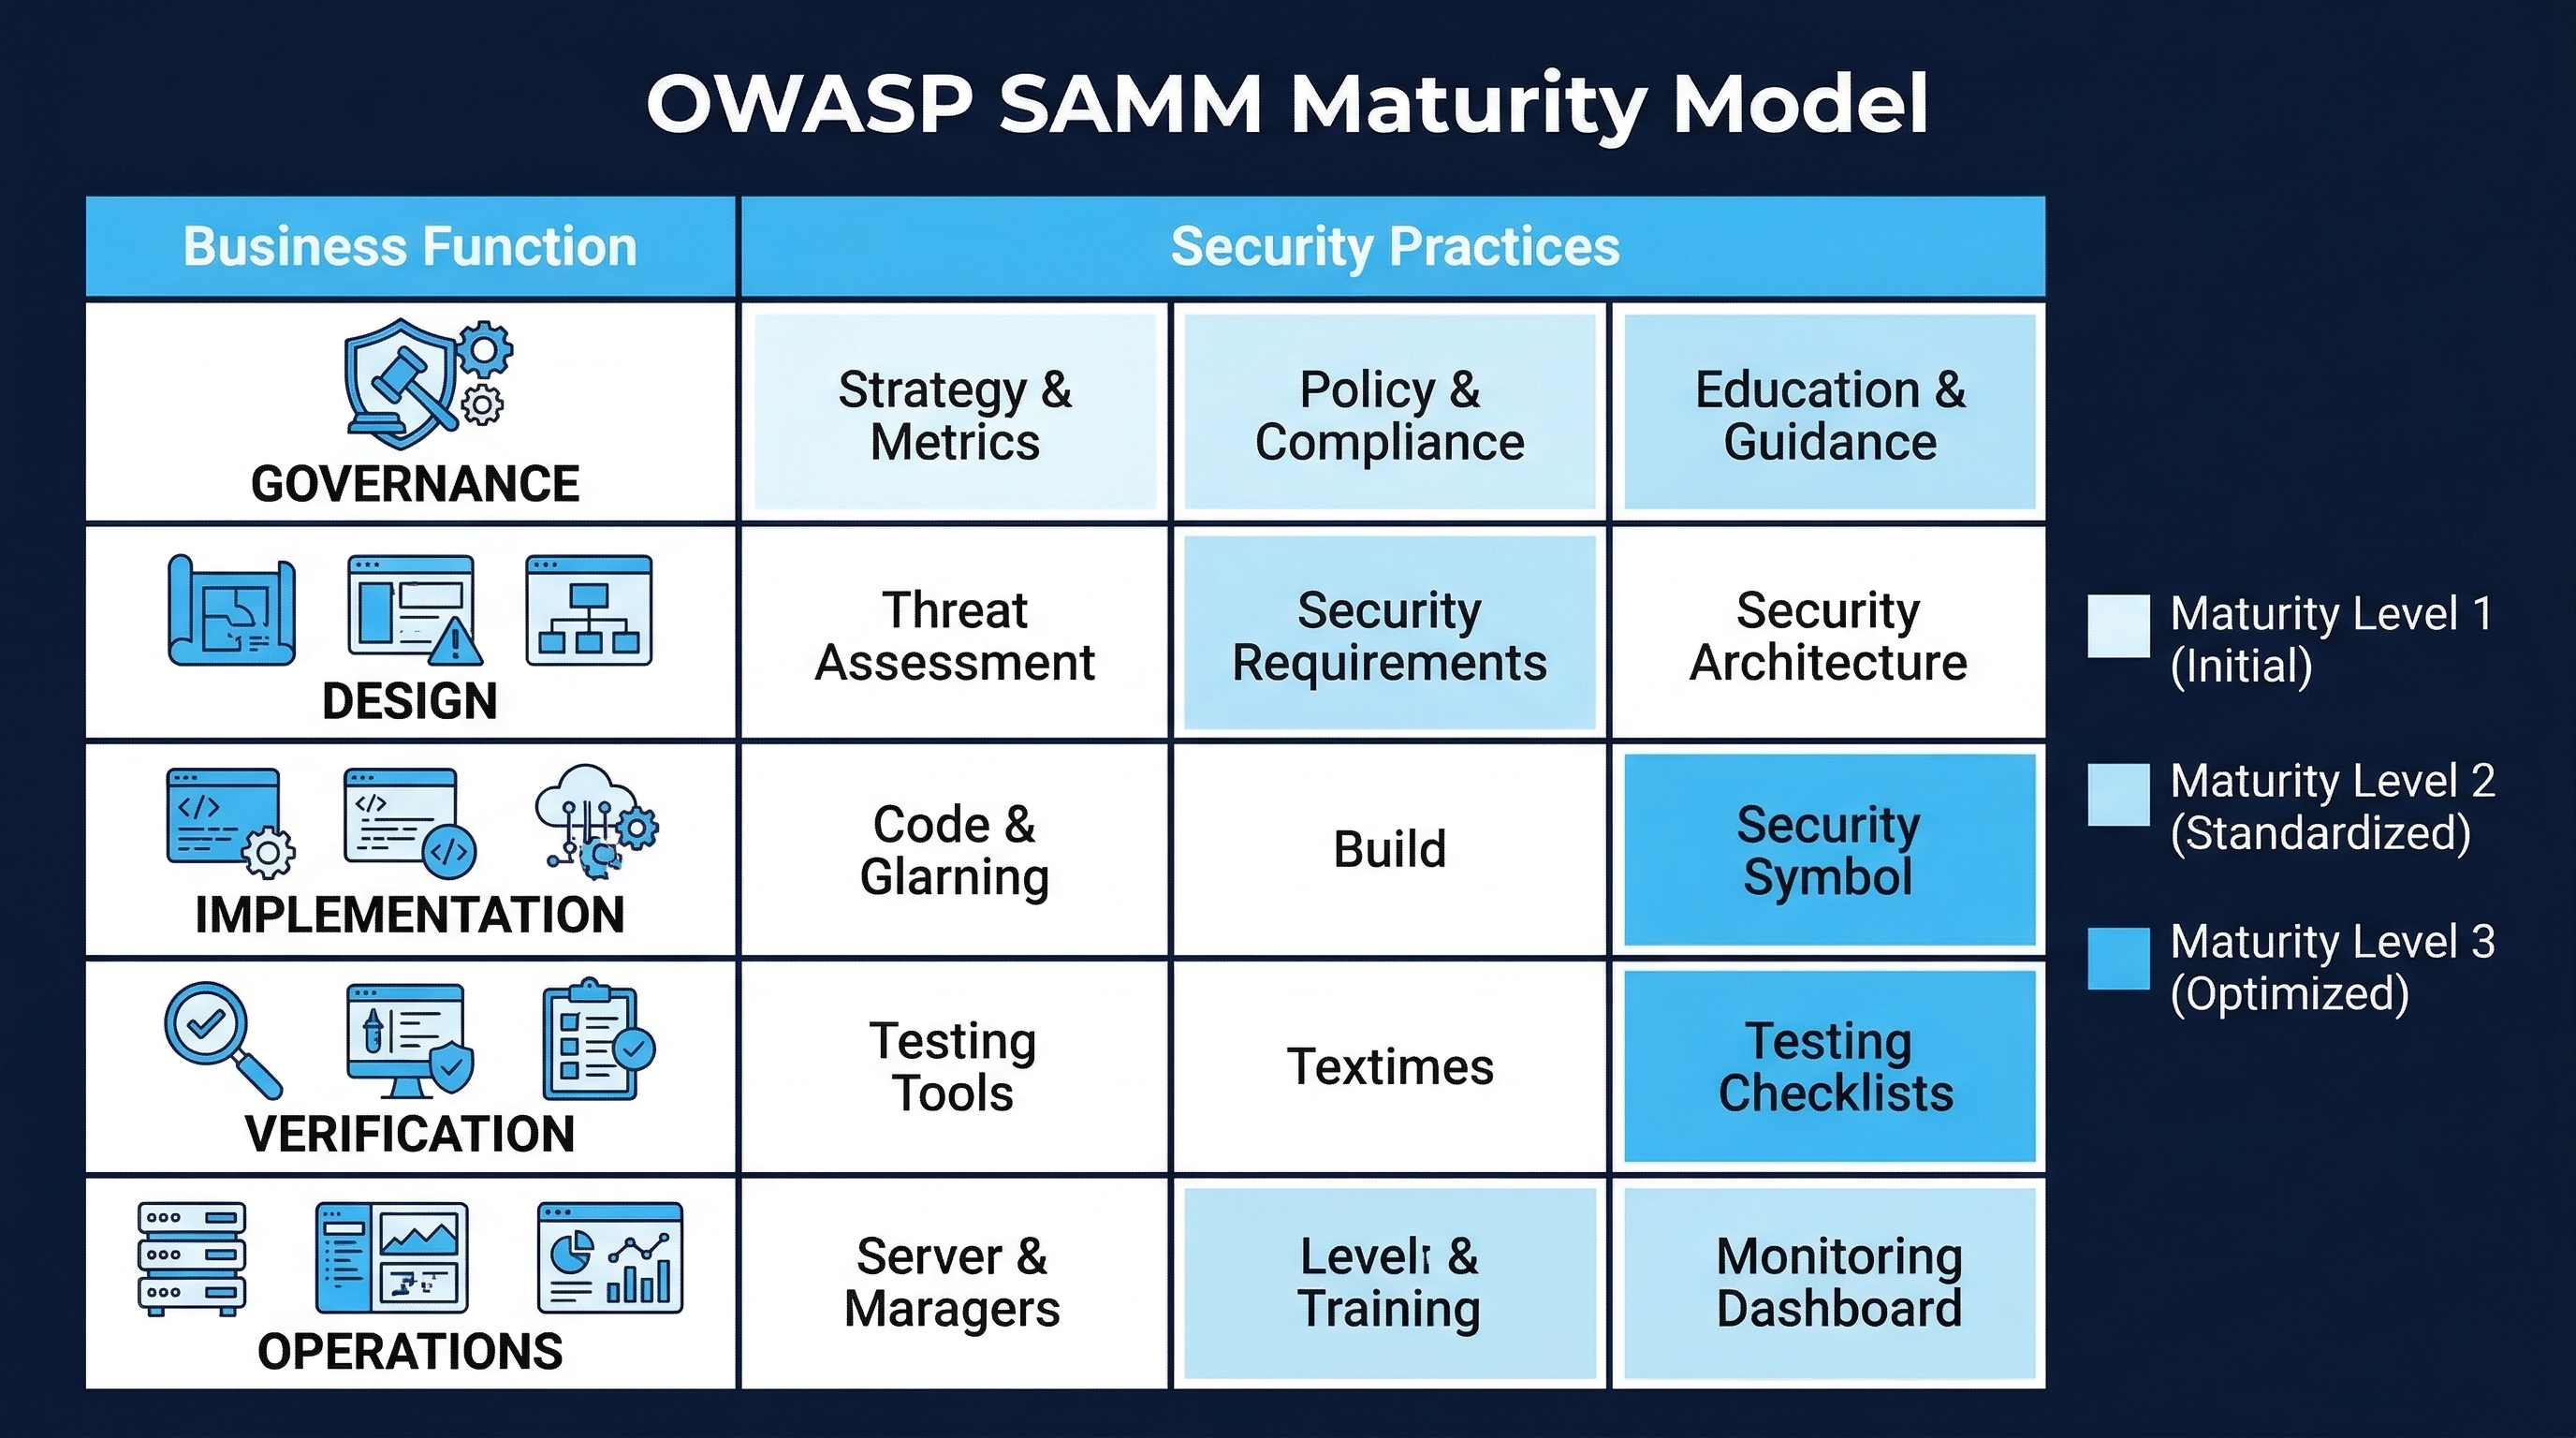 Figure: OWASP SAMM Maturity Model — Five business functions with three security practices each across four maturity levels
SAMM Structure
SAMM is organized into five business functions, each with three security practices:
| Business Function | Security Practices |
|---|---|
| Governance | Strategy & Metrics, Policy & Compliance, Education & Guidance |
| Design | Threat Assessment, Security Requirements, Security Architecture |
| Implementation | Secure Build, Secure Deployment, Defect Management |
| Verification | Architecture Assessment, Requirements-driven Testing, Security Testing |
| Operations | Incident Management, Environment Management, Operational Management |
Each practice is assessed at a maturity level from 0 (none) to 3 (mature):
Level 0 — Implicit: No formal activities. Security happens ad hoc, if at all.
Level 1 — Initial: Basic security practices are in place. Activities are performed but may not be consistent, documented, or comprehensive.
Level 2 — Managed: Security practices are defined, documented, and applied consistently across the organization. Metrics are collected.
Level 3 — Optimized: Security practices are continuously improved based on data. Activities are automated where possible. The program is integrated into the overall business strategy.
Conducting a SAMM Assessment
Step 1: Assemble the assessment team. Include representatives from development, security, operations, QA, and management. Each perspective contributes to an accurate assessment.
Step 2: Score each practice. For each of the 15 practices, evaluate the current state against the SAMM criteria. Use the SAMM assessment questionnaire (available at owaspsamm.org) as a structured guide.
Be honest. Overrating your current state defeats the purpose. Common error: confusing “we have a policy” with “we consistently follow the policy.” SAMM scores the practice, not the documentation.
Step 3: Document the baseline. Create a radar chart or scorecard showing the current maturity level for each practice. This is your baseline — the starting point from which all improvement will be measured.
Step 4: Define target maturity levels. Not every practice needs to be at Level 3. Target levels should reflect:
- Business risk profile: higher-risk organizations need higher maturity.
- Regulatory requirements: compliance mandates may require specific maturity levels.
- Resource availability: improvement requires investment.
- Industry benchmarks: what peer organizations have achieved.
A common starting target is Level 1 across all practices (eliminating gaps) with Level 2 in the highest-risk areas.
Step 5: Create a roadmap. For each practice gap (current level vs. target level), define:
- Specific activities needed to reach the target.
- Resource requirements (people, tools, budget).
- Timeline with milestones.
- Success criteria and metrics.
- Dependencies on other practices.
Step 6: Reassess periodically. Conduct a full SAMM reassessment annually. Track progress against the roadmap. Adjust targets and priorities based on business changes, new threats, and lessons learned.
3. BSIMM Benchmarking
The Building Security In Maturity Model (BSIMM) is a descriptive model based on real-world data from over 100 organizations. Unlike SAMM (which is prescriptive — “here is what you should do”), BSIMM is descriptive — “here is what organizations actually do.”
BSIMM Structure
BSIMM organizes software security activities into four domains and twelve practices:
| Domain | Practices |
|---|---|
| Governance | Strategy & Metrics, Compliance & Policy, Training |
| Intelligence | Attack Models, Security Features & Design, Standards & Requirements |
| SSDL Touchpoints | Architecture Analysis, Code Review, Security Testing |
| Deployment | Penetration Testing, Software Environment, Configuration Management & Vulnerability Management |
How to Use BSIMM
Benchmarking: Compare your organization’s activities against the BSIMM dataset. For each activity, see what percentage of participating organizations perform it. This tells you whether you are ahead of, behind, or aligned with industry practice.
Prioritization: Activities performed by the highest percentage of organizations are likely foundational — you should do them too. Activities performed by fewer organizations may represent advanced maturity or niche requirements.
Trend analysis: BSIMM is updated periodically with new data. Track which activities are increasing or decreasing in adoption to understand industry direction.
Key BSIMM Findings
Several findings from BSIMM data are particularly relevant to program managers:
Security awareness training is declining. Despite being nearly universal among early BSIMM participants, formal security awareness training has been declining in adoption. This does not mean training is less important — it means organizations are shifting toward more targeted, role-specific training and away from generic annual awareness programs. The insight is that generic security awareness training has limited measurable impact. Targeted training tied to specific roles, technologies, and vulnerability patterns is more effective.
Automation is increasing. Organizations are increasingly automating security activities (SAST, SCA, DAST integration into CI/CD) and decreasing reliance on manual security reviews. The shift toward “security as code” continues to accelerate.
Cloud security activities are now mainstream. Container security, infrastructure-as-code scanning, and cloud configuration review have moved from innovative to standard practice.
Software supply chain security is the fastest-growing area. SBOM generation, dependency analysis, and supply chain risk management have seen the largest increase in adoption.
4. Leading Indicators (Predictive)
Leading indicators measure activities and behaviors that predict future security outcomes. They answer the question: “Are we doing the things that will lead to better security?”
Training Metrics
| Metric | Target | Measurement Method |
|---|---|---|
| Training completion rate | >95% of eligible developers | LMS completion records |
| Assessment pass rate | >80% first attempt | Assessment platform scores |
| Assessment score trends | Upward over time | Average score per cohort per quarter |
| Time to complete modules | Within expected range | LMS time tracking (too fast = not engaging, too slow = struggling) |
| Training relevance rating | >4.0/5.0 | Post-training survey |
| Knowledge retention | >70% on 90-day retest | Scheduled reassessment |
Why these matter: Training completion alone does not indicate learning. A developer who clicks through slides in 10 minutes has “completed” training but learned nothing. Assessment scores, score trends, and engagement depth (time spent) provide a more accurate picture of actual learning.
Engagement Metrics
| Metric | Target | Measurement Method |
|---|---|---|
| CTF/tournament participation rate | >50% of developers | Platform participation records |
| Security champion coverage | 1 champion per 10-20 developers | Champion program roster |
| Voluntary training uptake | Increasing trend | LMS enrollment records for optional content |
| Security question volume | Increasing trend | Slack channel analytics, office hours attendance |
| Knowledge sharing events | At least monthly per champion | Event calendar tracking |
| Platform login frequency | Weekly for active developers | Platform analytics |
Why these matter: Engagement metrics measure security culture. An organization where developers voluntarily participate in CTFs, ask security questions, and share security knowledge has a fundamentally different security posture than one where developers do the minimum required training and move on.
Process Metrics
| Metric | Target | Measurement Method |
|---|---|---|
| Code review security comments | Increasing trend | Code review platform analytics |
| Threat model coverage | 100% of new features | Threat model registry |
| Security requirements in user stories | >80% of stories for sensitive features | Story tracking analysis |
| Tool adoption rate (CI) | >90% of repos | CI/CD pipeline configuration audit |
| Tool adoption rate (IDE) | >50% of developers | IDE plugin telemetry |
5. Lagging Indicators (Outcome-Based)
Lagging indicators measure results — the actual security outcomes the program is designed to improve. They answer the question: “Is our security actually getting better?”
Vulnerability Metrics
| Metric | Target | Measurement Method |
|---|---|---|
| Vulnerability density | Decreasing trend (vulns per 1,000 LOC) | Scanner data normalized by codebase size |
| Mean Time to Remediate (MTTR) | Decreasing, within SLA targets | Vulnerability tracking system |
| Mean Time to Detect (MTTD) | Approaching zero (shift-left) | Time from code commit to vulnerability detection |
| Pre-production detection rate | >80% caught before production | Compare pre-prod findings to production findings |
| Security debt ratio | Decreasing (unresolved vulns / total open issues) | Vulnerability tracking system |
| Recurrence rate | Decreasing (same vuln type after training) | CWE-based tracking over time |
| Production security incidents | Decreasing (incidents from code-level vulns) | Incident tracking system |
| False positive rate | Decreasing (indicates better tool tuning) | Scanner validation data |
MTTR Targets by Severity
| Severity | MTTR Target | Industry Benchmark (Median) |
|---|---|---|
| Critical | 24 hours | 5-7 days |
| High | 7 days | 30 days |
| Medium | 30 days | 90 days |
| Low | 90 days | 180+ days |
Organizations that consistently meet these targets are in the top quartile of their peers. The gap between targets and industry benchmarks shows both the ambition required and the improvement opportunity.
Detection Phase Distribution
Track where vulnerabilities are discovered in the SDLC:
| Phase | Ideal Target | Why |
|---|---|---|
| Design (threat modeling) | 15-20% | Cheapest to fix, prevents entire classes of issues |
| Development (IDE + commit) | 30-40% | Fixed immediately by the developer who wrote the code |
| Build (CI pipeline) | 20-30% | Caught before code reaches shared environments |
| Test (staging/QA) | 5-10% | Caught before production but more expensive to fix |
| Production (monitoring/pen test) | <5% | Most expensive, may require incident response |
| External (researchers/customers) | <2% | Indicates external parties finding what you missed |
A mature program shifts left: the majority of vulnerabilities are discovered during design and development, not in production. Track this distribution over time to measure shift-left progress.
6. AI-Specific Metrics
The integration of AI into the development lifecycle requires a new category of metrics that did not exist before 2023. These metrics are essential for understanding whether AI is helping or hurting your security posture.
AI Code Quality Metrics
| Metric | Baseline | Target | Source |
|---|---|---|---|
| AI suggestion acceptance rate | ~30% (GitHub Copilot reported) | Not a target — understand context | AI tool telemetry |
| AI vulnerability introduction rate | 2.74x human baseline (Veracode 2025) | Approaching 1.0x (parity with human code) | Scanner data + code attribution |
| AI code mutation score | Varies | >60% | Mutation testing of AI-generated code |
| Human override rate | Varies | Tracked for trends | Code review data + AI telemetry |
| AI code review coverage | Varies | 100% for security-sensitive code | Code review records |
| Secret leakage rate | 6.4% baseline (Copilot-generated code) | <1% | Secret scanner data + code attribution |
AI Process Metrics
| Metric | Target | Source |
|---|---|---|
| AI-attributable defect rate | Decreasing trend | Post-deployment defect analysis + code attribution |
| Time-to-detection: AI bugs vs human bugs | Equal or better for AI bugs | Defect tracking system |
| Shadow AI detection rate | >90% of unauthorized AI tool usage detected | Network monitoring, DLP, CASB |
| AI policy compliance rate | >95% | Policy audit data |
| AI tool coverage (approved vs unapproved) | >95% usage on approved tools | Tool inventory + usage monitoring |
| AI training completion rate | >95% of developers | LMS completion records |
| AI incident rate | Decreasing trend | Incident tracking system |
Interpreting AI Metrics
AI suggestion acceptance rate (~30%): This is not inherently good or bad. A very low rate may indicate the AI tool is not providing value. A very high rate may indicate developers are accepting suggestions without critical evaluation (automation bias). The key is to understand the context: what types of suggestions are being accepted, and are accepted suggestions later found to be problematic?
AI vulnerability introduction rate (2.74x human baseline): The Veracode 2025 data showed that AI-generated code contained vulnerabilities at 2.74 times the rate of human-written code. This is a critical metric. If your organization is using AI coding tools without additional safeguards, you may be introducing more vulnerabilities than you are catching. Track this metric over time as AI tools improve and as your guardrails (SAST, code review, AI-specific policies) take effect.
Secret leakage rate (6.4% baseline): The Stanford/UC Berkeley research found that GitHub Copilot-generated code contained hardcoded secrets (API keys, passwords, tokens) in approximately 6.4% of suggestions. This metric must be tracked and driven down through AI tool configuration, secret scanning in the IDE and CI/CD pipeline, and developer training on secret management.
7. Correlation Analysis
Individual metrics are useful. Correlated metrics are powerful. Correlation analysis connects program activities (leading indicators) to security outcomes (lagging indicators), proving cause and effect.
Training Effectiveness Correlation
Vulnerability density: trained vs. untrained developers. Compare the vulnerability density (vulns per 1,000 LOC) of code written by developers who have completed security training against those who have not. Significant difference validates training investment.
Control for confounding factors:
- Seniority (more experienced developers may write fewer vulnerabilities regardless of training).
- Technology (some languages/frameworks are inherently more secure).
- Code complexity (security-critical code is harder to write correctly).
MTTR before and after training cohorts. Track the average MTTR for vulnerability remediation by developers before and after they complete security training. Faster MTTR after training indicates developers can identify and fix security issues more effectively.
Recurrence rates after targeted training. When a developer receives targeted training on a specific vulnerability type (e.g., XSS), track whether they continue to introduce that vulnerability type. Decreasing recurrence validates the training’s effectiveness for that specific topic.
Benchmarking Against Peers
Secure Code Warrior Trust Score: If using Secure Code Warrior for training, the Trust Score provides a developer-level and team-level metric that measures security knowledge, training engagement, and code review activity. Benchmark against industry data.
BSIMM percentile ranking: If participating in BSIMM, compare your activity adoption against the full dataset. Identify activities where you are below the 50th percentile — these are areas where most of your peers have matured beyond your current state.
Verizon DBIR data: Use the annual Verizon Data Breach Investigations Report to benchmark your vulnerability types against industry-wide breach data. If 30% of breaches in your industry involve web application attacks, and your production web application vulnerability rate is declining, you are reducing your exposure to the most common attack vectors.
Research Correlation
Published research provides additional correlation evidence:
- 70% fewer security incidents with robust, ongoing security training programs (SANS/GIAC research).
- 3x less likely to suffer breach with exposure-based vulnerability prioritization (Tenable/Cyentia research).
- 60-80% reduction in effective remediation workload with EPSS-based prioritization (FIRST research).
- 50% reduction in vulnerability escape rate when SAST is integrated in IDE + CI/CD (Synopsys BSIMM data).
These correlations support the business case for program investment by connecting activities to measurable outcomes.
8. Security Champions Program Metrics
The Security Champions program is a force multiplier for the SSDLC program. Metrics track its health and impact.
Coverage and Structure
| Metric | Target | Description |
|---|---|---|
| Champion coverage ratio | 1:10-20 developers | Every team should have at least one champion |
| Champion distribution | Every product team represented | No teams without champion coverage |
| Champion tenure | >12 months average | Champions need time to be effective |
| Champion churn rate | <20% annually | High churn indicates burnout or lack of support |
Activity and Growth
| Metric | Target | Description |
|---|---|---|
| Belt progression rates | Upward trend | Champions advancing through training levels |
| Mentoring activity | Each champion mentoring 2+ developers | Active mentoring drives team-wide improvement |
| Security review participation | Champions involved in >80% of team security reviews | Champions as security review participants |
| Knowledge sharing events | Monthly per champion | Presentations, workshops, brown bags |
| Tool champion activities | Each champion proficient in >=2 security tools | Champions as tool experts for their teams |
Impact Metrics
| Metric | Target | Description |
|---|---|---|
| Security culture survey | Improving trend | Annual survey measuring developer security attitudes |
| Champion team vs non-champion team vuln density | Champion teams lower | Compare vulnerability density across teams |
| Time to adopt new security practices | Champion teams faster | Measure how quickly teams implement new security requirements |
| Security question routing | >50% resolved by champions (not AppSec) | Champions as first line of security guidance |
9. Reporting
Metrics are only useful if they reach the right audience in the right format at the right time.
Executive Dashboards
Audience: CTO, CISO, VP Engineering, Board members. Frequency: Monthly summary, quarterly deep dive. Focus: Business risk, trends, compliance, ROI.
Content:
- Overall risk posture: Single metric or traffic light showing current risk level and trend direction.
- Vulnerability backlog trend: Total open vulnerabilities by severity over time (should be stable or decreasing).
- SLA compliance: Percentage of vulnerabilities remediated within SLA, by severity.
- Production incident trend: Security incidents from code-level vulnerabilities over time.
- Program maturity progress: SAMM or BSIMM scores compared to target.
- Investment efficiency: Cost per vulnerability found and fixed, compared to cost of security incidents.
- Compliance status: Current compliance posture against applicable frameworks.
Rules for executive dashboards:
- No more than 7 metrics on a single view.
- Every metric must have a trend (up/down/stable) and a context (good/bad/neutral).
- Use red/yellow/green sparingly and only with clear, documented thresholds.
- Include narrative: what do the numbers mean? What action is needed?
Technical Dashboards
Audience: AppSec team, engineering managers, team leads, security champions. Frequency: Real-time to weekly. Focus: Tool-specific metrics, finding details, SLA compliance, team performance.
Content:
- Scanner findings by tool, severity, and CWE: What are the scanners finding?
- False positive rates by tool and rule: Are the tools tuned correctly?
- MTTR by team and severity: Which teams are fast/slow at remediation?
- Pipeline gate blocks: How many builds are being blocked by security gates? What is the override rate?
- Dependency vulnerability status: Known vulnerable dependencies by severity and EPSS.
- AI code metrics: AI suggestion acceptance rates, AI-attributable defects, shadow AI detections.
- Training completion and assessment scores by team: Which teams need attention?
Quarterly Program Reviews
Format: 60-minute meeting with stakeholders (engineering leadership, security leadership, product management).
Agenda:
- Program status (10 min): Key metrics, trends, highlights.
- Accomplishments (10 min): What was achieved this quarter? What milestones were hit?
- Challenges (10 min): What is not working? Where are we falling short?
- Metrics deep dive (15 min): Detailed analysis of key metrics and correlations.
- Next quarter plan (10 min): Priorities, resource needs, targets.
- Discussion (5 min): Questions, feedback, decisions needed.
Annual Maturity Assessment
Format: Formal SAMM or BSIMM reassessment.
Deliverable: Comprehensive report including:
- Current maturity scores compared to baseline and previous year.
- Progress against roadmap milestones.
- Updated roadmap for the next year.
- Budget request with ROI justification based on measured outcomes.
- Industry benchmarking comparison.
10. Continuous Improvement Cycle
Metrics without action are just expensive dashboards. The continuous improvement cycle ensures that data drives change.
The Metrics-Action Loop
Measure → Analyze → Identify → Plan → Execute → Verify → Repeat- Measure: Collect leading and lagging indicators per the metrics program.
- Analyze: Identify trends, anomalies, and correlations. Compare against targets and benchmarks.
- Identify: Determine what is working (reinforce), what is not working (address), and what is missing (add).
- Plan: Define specific improvement actions with owners, timelines, and success criteria.
- Execute: Implement the improvements.
- Verify: Measure the impact of the improvements. Did the metrics move in the expected direction?
- Repeat: Continuously cycle through the loop.
Common Improvement Actions
| Metric Signal | Possible Root Cause | Improvement Action |
|---|---|---|
| Training completion low | Content not engaging, time not allocated | Gamify training, allocate sprint time, manager accountability |
| Assessment scores declining | Content stale, new technology gaps | Update content, add new modules, adjust difficulty |
| Vulnerability density increasing | New technology adoption, developer turnover | Targeted training, improved onboarding, tool configuration |
| MTTR increasing | Process bottleneck, capacity constraint | Automate triage, increase AppSec capacity, improve tooling |
| Pre-production detection low | Tool gaps, insufficient coverage | Add tools, expand scan scope, improve rule configuration |
| Recurrence rate high | Training not addressing root cause | Redesign training with hands-on labs, enforce SAST rules |
| AI defect rate high | Insufficient AI code review | Mandate human review for AI code, improve SAST for AI patterns |
| Champion churn high | Burnout, insufficient recognition | Reduce champion load, add recognition/rewards, management support |
| False positive rate high | Scanner misconfiguration | Tune rules, adjust thresholds, add context filters |
| SLA compliance declining | Priorities competing, unrealistic SLAs | Review SLAs, protect remediation time, executive support |
Avoiding Metric Gaming
Metrics that are tied to performance evaluations or compensation will be gamed. Common gaming behaviors:
- Closing vulnerabilities without fixing them: Marking findings as “won’t fix” or “false positive” to improve MTTR. Counter with audit of closed findings.
- Splitting large fixes into multiple tickets: Inflating “vulnerabilities fixed” count. Counter with deduplication logic.
- Racing through training: Completing modules in minimum time without engagement. Counter with assessment scores as the primary metric, not completion alone.
- Downgrading severity: Classifying High vulnerabilities as Medium to avoid SLA pressure. Counter with independent severity validation.
- Counting work-in-progress as complete: Counter with verification requirements before closure.
The antidote to gaming is measuring outcomes (vulnerability density, production incidents, breach probability) rather than activities (tickets closed, training completed, scans run). Outcomes are harder to game because they reflect reality.
Key Takeaways
- Metrics are infrastructure, not overhead. Without metrics, you cannot demonstrate improvement, justify investment, or make informed decisions.
- Use SAMM for prescriptive guidance and BSIMM for descriptive benchmarking. SAMM tells you what to do. BSIMM tells you what your peers are doing. Both are valuable.
- Lead with leading indicators, prove with lagging indicators. Leading indicators predict future outcomes. Lagging indicators confirm past results. You need both.
- AI-specific metrics are non-negotiable in 2026. AI vulnerability introduction rate (2.74x baseline), secret leakage rate (6.4% baseline), shadow AI detection, and AI-attributable defects must be tracked.
- Correlation proves causation over time. Comparing vulnerability density between trained and untrained developers, tracking MTTR before and after training, and measuring recurrence rates after targeted training connect program activities to security outcomes.
- Dashboards must match the audience. Executives need 7 metrics with trends and narrative. Technical teams need detailed, real-time data. Quarterly reviews bring everyone together.
- Measure outcomes, not just activities. Activities can be gamed. Outcomes reflect reality. A 95% training completion rate means nothing if vulnerability density is increasing.
Practical Exercise
Exercise 1: SAMM Baseline Assessment Using the OWASP SAMM assessment tool (owaspsamm.org), conduct a baseline assessment for your organization. Score each of the 15 practices. Document the current state, evidence supporting the score, and gaps identified. Present the results as a radar chart.
Exercise 2: Metrics Dashboard Design Design an executive dashboard and a technical dashboard for your SSDLC program. For each metric:
- Define the metric precisely (name, formula, data source).
- Set a target with justification.
- Define the reporting frequency.
- Determine red/yellow/green thresholds.
- Create a mock visualization.
Exercise 3: AI Metrics Baseline Establish baseline measurements for your organization’s AI-specific metrics:
- What is the current AI suggestion acceptance rate?
- What is the current vulnerability rate in AI-generated code vs. human-written code?
- How much shadow AI usage exists?
- What percentage of developers have completed AI security training? Identify the three highest-priority AI metrics for your organization and define improvement targets for the next quarter.
Exercise 4: Correlation Analysis Select one leading indicator and one lagging indicator. Collect data for the past 6-12 months. Analyze the correlation between them. Present your findings: is the leading indicator predictive of the lagging indicator? What confounding factors might affect the relationship? What additional data would strengthen the analysis?
References
- CIS Controls v8, Safeguard 16.1: Establish and Maintain a Secure Application Development Process
- CIS Controls v8, Safeguard 16.9: Training Program for Application Developers
- OWASP SAMM v2.0: https://owaspsamm.org/
- BSIMM: https://www.bsimm.com/
- Veracode State of Software Security 2025
- GitHub Innovation Graph: Copilot Metrics
- FIRST EPSS: https://www.first.org/epss/
- Tenable Research: Exposure-Based Prioritization
- SANS Security Awareness Report
- Verizon Data Breach Investigations Report (DBIR)
- Secure Code Warrior Trust Score: https://www.securecodewarrior.com/trust-score
Study Guide
Key Takeaways
- Metrics serve four functions — Demonstrate ROI, identify trends, inform resource allocation, create accountability.
- SAMM is prescriptive, BSIMM is descriptive — SAMM tells you what to do; BSIMM tells you what peers actually do; both are valuable.
- SAMM has four maturity levels — Level 0 (Implicit), Level 1 (Initial), Level 2 (Managed), Level 3 (Optimized).
- AI-specific metrics are non-negotiable in 2026 — AI vulnerability rate (2.74x), secret leakage (6.4%), override rate, AI-attributable defects.
- Measure outcomes, not just activities — Activities can be gamed; outcomes reflect reality; 95% training completion means nothing if vulnerability density increases.
- Security champion ratio 1:10-20 developers — Every team represented; 12+ months tenure needed; <20% annual churn target.
- 70% fewer incidents with robust training — SANS/GIAC research; 3x less likely to breach with EPSS-based prioritization.
Important Definitions
| Term | Definition |
|---|---|
| OWASP SAMM | Software Assurance Maturity Model — prescriptive framework for assessing and improving security programs |
| BSIMM | Building Security In Maturity Model — descriptive model based on real-world data from 100+ organizations |
| Leading Indicator | Measures activities and behaviors predicting future security outcomes |
| Lagging Indicator | Measures actual security outcomes confirming past results |
| Vulnerability Density | Vulnerabilities per 1,000 lines of code; primary outcome metric |
| Detection Phase Distribution | Where vulnerabilities are found in the SDLC (design through external) |
| Security Champion | Developer serving as persistent security contact for their team |
| Correlation Analysis | Connecting program activities (leading) to security outcomes (lagging) |
| MTTR | Mean Time to Remediate by severity; key lagging indicator |
| Metric Gaming | Manipulating metrics without improving outcomes (e.g., closing vulns as “won’t fix”) |
Quick Reference
- MTTR Targets: Critical 24h (industry median 5-7d), High 7d (30d), Medium 30d (90d), Low 90d (180d+)
- Ideal Detection Distribution: Design 15-20%, Development 30-40%, Build 20-30%, Test 5-10%, Production <5%, External <2%
- Executive Dashboard: Max 7 metrics, every metric has trend + context, includes narrative
- AI Metrics: Acceptance rate (~30%), vulnerability rate (2.74x), mutation score (>60%), override rate (30-50%), secret leakage (<1%)
- Common Pitfalls: Measuring activities not outcomes, too many metrics on dashboards, no correlation analysis, gaming via “won’t fix” closures, generic training without role-specific content
Review Questions
- Explain the difference between SAMM and BSIMM, and describe a scenario where you would use each.
- Design an executive dashboard with 7 or fewer metrics that demonstrates SSDLC program value, including trends and thresholds.
- How would you correlate training completion (leading) with vulnerability density (lagging) to prove training ROI?
- Your organization’s AI code comprises 30% of the codebase but 60% of defects — which metrics would you examine and what actions would you take?
- Describe three common metric gaming behaviors and how measuring outcomes instead of activities prevents each.